ER Diagram Theory
An ER (Entity-Relationship) Diagram is a visual representation of the structure of a database. It illustrates the entities, their attributes, and the relationships between them.
Key Components of an ER Diagram
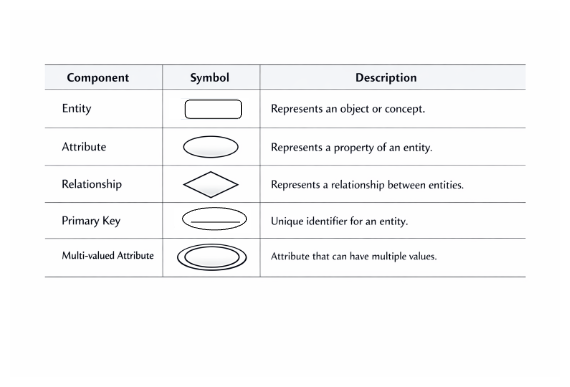
- Entities: Represented by rectangles, entities are objects or concepts that can have data stored about them (e.g., Student, Course).
- Attributes: Represented by ovals, attributes are properties or details about an entity (e.g., Student Name, Course ID).
- Relationships: Represented by diamonds, relationships show how entities are related to each other (e.g., Enrolls, Teaches).
Symbols and Notations
Types of Relationships
Basically there are three types of relationships in an ER Diagram: - One-to-One (1:1) - One-to-Many (1:N) - Many-to-Many (N:M)
Which to Select for example:
We have two entity A and B
- If one record in A is related to only one record in B and vice versa, then it is 1:1 relationship.
- If one record in A is related to multiple records in B, but one record in B is related to only one record in A, then it is 1:N relationship.
- If one record in B is related to multiple records in A, but one record in A is related to only one record in B, then it is N:1 relationship.
- If one record in A is related to multiple records in B and one record in B is related to multiple records in A, then it is N:M relationship.