Introduction
Instead of relying on print statements to examine variable values during code execution, VS Code’s built-in debugger offers a more powerful and efficient approach to troubleshooting. The debugger allows you to inspect variables, track program flow, and identify issues with precision.
What is a Debugger?
A debugger is a specialized development tool that enables you to:
- Execute your code line by line
- Pause execution at specific points
- Examine the state of variables and objects at any moment
- Monitor the execution flow of your program
This approach provides significantly more insight than simple print statements, making the debugging process more efficient and thorough.
How to Use the Debugger in VS Code
Setting Breakpoints
Breakpoints are markers that tell the debugger where to pause code execution. They are essential for examining the program state at specific points.
How to set a breakpoint:
- Locate the line of code where you want to pause execution
- Click in the left margin (gutter) next to the line number
- A red dot will appear, indicating a successful breakpoint placement
- Types of breakpoints:
- Normal Breakpoint: This is the most common type of breakpoint. It pauses execution at a specific line of code.
- Conditional Breakpoint: This type of breakpoint only pauses execution if a specific condition is met. To set a conditional breakpoint, right-click on the red dot and select “Edit Breakpoint”. You can then enter a condition that must be true for the breakpoint to be hit. for exmaple a condition like
x > 5will only hit the breakpoint if the value ofxis greater than 5. - Hit Count Breakpoint: This type of breakpoint only pauses execution after it has been hit a specific number of times. To set a hit count breakpoint, right-click on the red dot and select “Edit Breakpoint”. You can then enter a hit count that must be reached for the breakpoint to be hit. for example a hit count like
5will only hit the breakpoint after it has been hit 5 times. - Logpoint: This type of breakpoint does not pause execution but logs a message to the console when it is hit. To set a logpoint, right-click on the red dot and select “Edit Breakpoint”. You can then enter a message that will be logged to the console when the logpoint is hit. for example a logpoint like
x = {x}will log the value ofxto the console when the logpoint is hit.
Debugging
After setting breakpoints, you can start debugging your code. To do this, click on the green play button in the debug panel or press F5. This will start the debugger and run your code until it hits a breakpoint. When the debugger hits a breakpoint, it will pause execution and allow you to inspect variables and see the flow of execution and required information.
Inspecting Variables
When the debugger hits a breakpoint, you can inspect the values of variables in the debug panel. This allows you to see the current state of your code and find issues more efficiently than using print statements. You can also hover over variables in the code editor to see their values.It look like
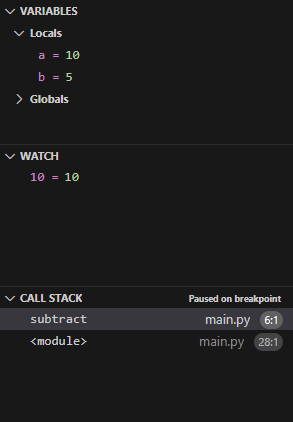
Here is a breakdown of the different sections of the debug panel:
- Variables: This section shows the current values of all variables in the current scope. You can expand objects and arrays to see their properties and values.Also You can change their values by double-clicking on them and entering a new value.
- Watch: This section allows to watch a specific variable or expression. You can add variables or expressions to the watch list by clicking on the plus icon and entering the variable or expression you want to watch. This is useful for tracking the value of a variable or expression over time.
- Call Stack: This section shows the current call stack, which is the list of functions that have been called to get to the current point in the code. You can click on a function in the call stack to see its code and inspect its variables. This is useful for understanding the flow of execution and seeing how functions interact with each other.
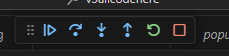
After running the debugger, you will see a new panel at the top of the screen with several options. These options allow you to control the flow of execution and inspect variables.
- Continue: This option allows you to continue execution until the next breakpoint is hit.
- Step Over: This option allows you to execute the current line of code and move to the next line. If the current line contains a function call, it will execute the entire function and move to the next line without stepping into the function.
- Step Into: This option allows you to step into a function call and see the flow of execution inside the function. This is useful for debugging functions and seeing how they work.
- Step Out: This option allows you to step out of the current function and return to the calling function. This is useful for debugging nested functions and seeing how they interact with each other.
- Restart: This option allows you to restart the debugger and run your code from the beginning. This is useful for testing changes to your code without having to stop and start the debugger manually.
- Stop: This option allows you to stop the debugger and end the debugging session. This is useful for stopping the debugger when you are finished debugging your code.
Example of Debugging
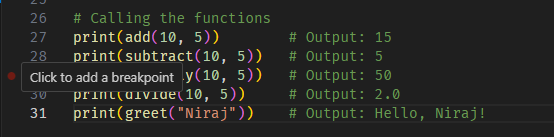
First, Add breakpoints to your code by clicking on the left margin next to the line number where you want to pause execution.
Second, Start debugging your code by clicking on the green play button in the debug panel or pressing F5. This will start the debugger and run your code until it hits a breakpoint.
Then , When the debugger hits a breakpoint, it will pause execution and allow you to inspect variables and see the flow of execution. You can use the debug panel to see the current values of variables, watch specific variables or expressions, and see the call stack and change the values of variables.
After that ,Your can use debug pannel to control the flow of execution. You can continue execution.